Plots a 2d scatter plot of the input data.
Usage
scatter_chart(
  xcol = 1,
  ycol = 2,
  points_to_label = "none",
  factor_name = "none",
  ellipse = "all",
  ellipse_type = "norm",
  ellipse_confidence = 0.95,
  label_filter = character(0),
  label_factor = "rownames",
  label_size = 3.88,
  ...
)
Arguments
- xcol
(numeric, integer, character) The column name, or index, of data to plot on the x-axis. The default is
1.- ycol
(numeric, integer, character) The column name, or index, of data to plot on the y-axis. The default is
2.- points_to_label
(character) Points to label. Allowed values are limited to the following:
"none": No samples labels are displayed."all": The labels for all samples are displayed."outliers": Labels for for potential outlier samples are displayed.
The default is
"none".- factor_name
(character) The name of a sample-meta column to use. The default is
"none".- ellipse
(character) Plot ellipses. Allowed values are limited to the following:
"all": Ellipses are plotted for all groups and all samples."group": Ellipses are plotted for all groups."none": Ellipses are not included on the plot."sample": An ellipse is plotted for all samples (ignoring group).
The default is
"all".- ellipse_type
(character) Type of ellipse. Allowed values are limited to the following:
"norm": Multivariate normal (p = 0.95)."t": Multivariate t (p = 0.95).
The default is
"norm".- ellipse_confidence
(numeric) The confidence level for plotting ellipses. The default is
0.95.- label_filter
(character) Labels are only plotted for the named groups. If zero-length then all groups are included. The default is
character(0).- label_factor
(character) The column name of sample_meta to use for labelling samples on the plot. "rownames" will use the row names from sample_meta. The default is
"rownames".- label_size
(numeric) The text size of labels. Note this is not in Font Units. The default is
3.88.- ...
Additional slots and values passed to
struct_class.
Value
A
scatter_chart
object. This object has no output slots.
See chart_plot in the struct package to plot this chart object.
Inheritance
A scatter_chart object inherits the following struct classes: [scatter_chart] >> [chart] >> [struct_class]
Examples
M = scatter_chart(
xcol = 1,
ycol = 2,
points_to_label = "none",
factor_name = "V1",
ellipse = "all",
label_filter = character(0),
label_factor = "rownames",
label_size = 3.88,
ellipse_type = "norm",
ellipse_confidence = 0.95)
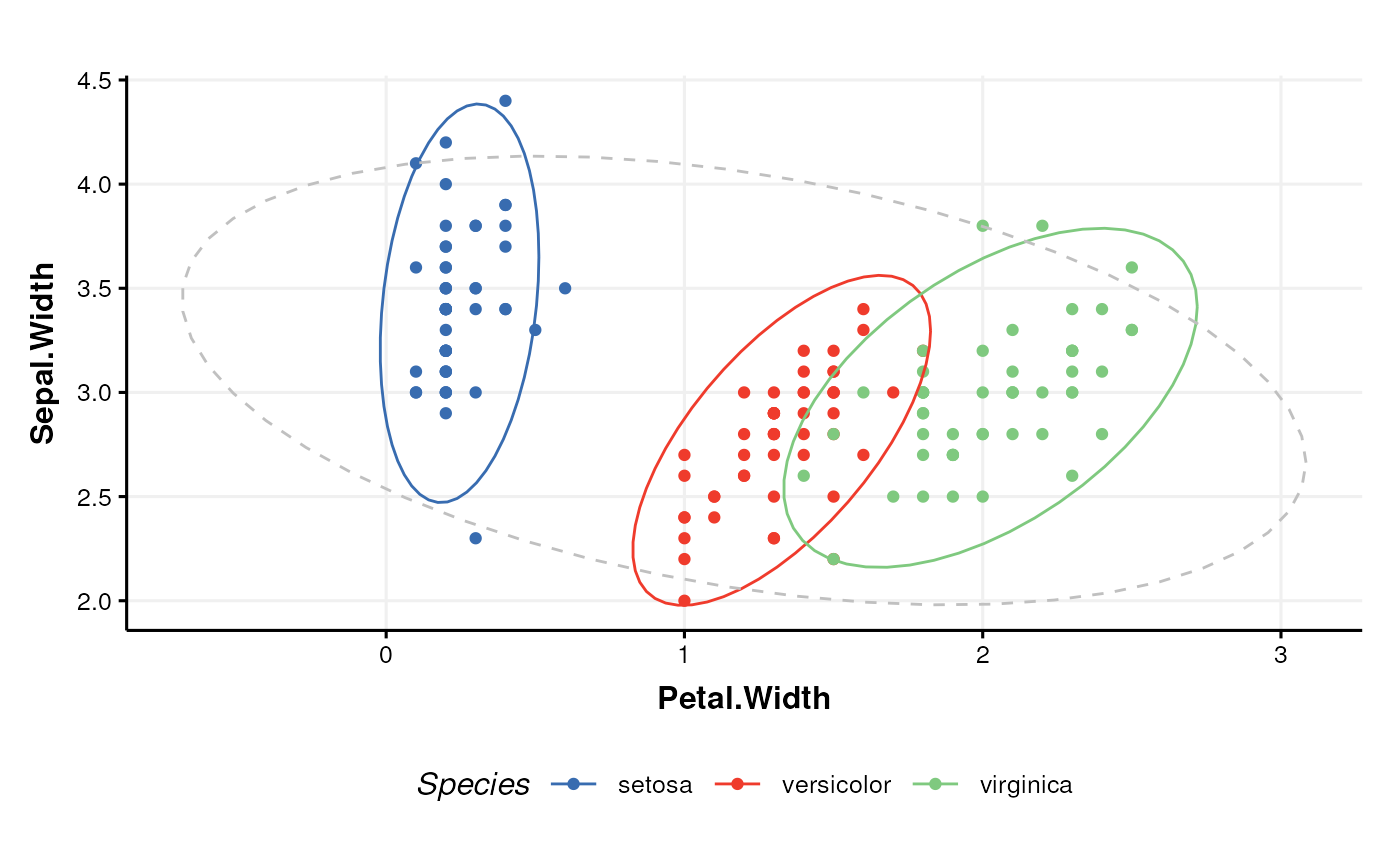
D = iris_DatasetExperiment()
C = scatter_chart(
xcol = 'Petal.Width',
ycol = 'Sepal.Width',
factor_name = 'Species'
)
chart_plot(C,D)