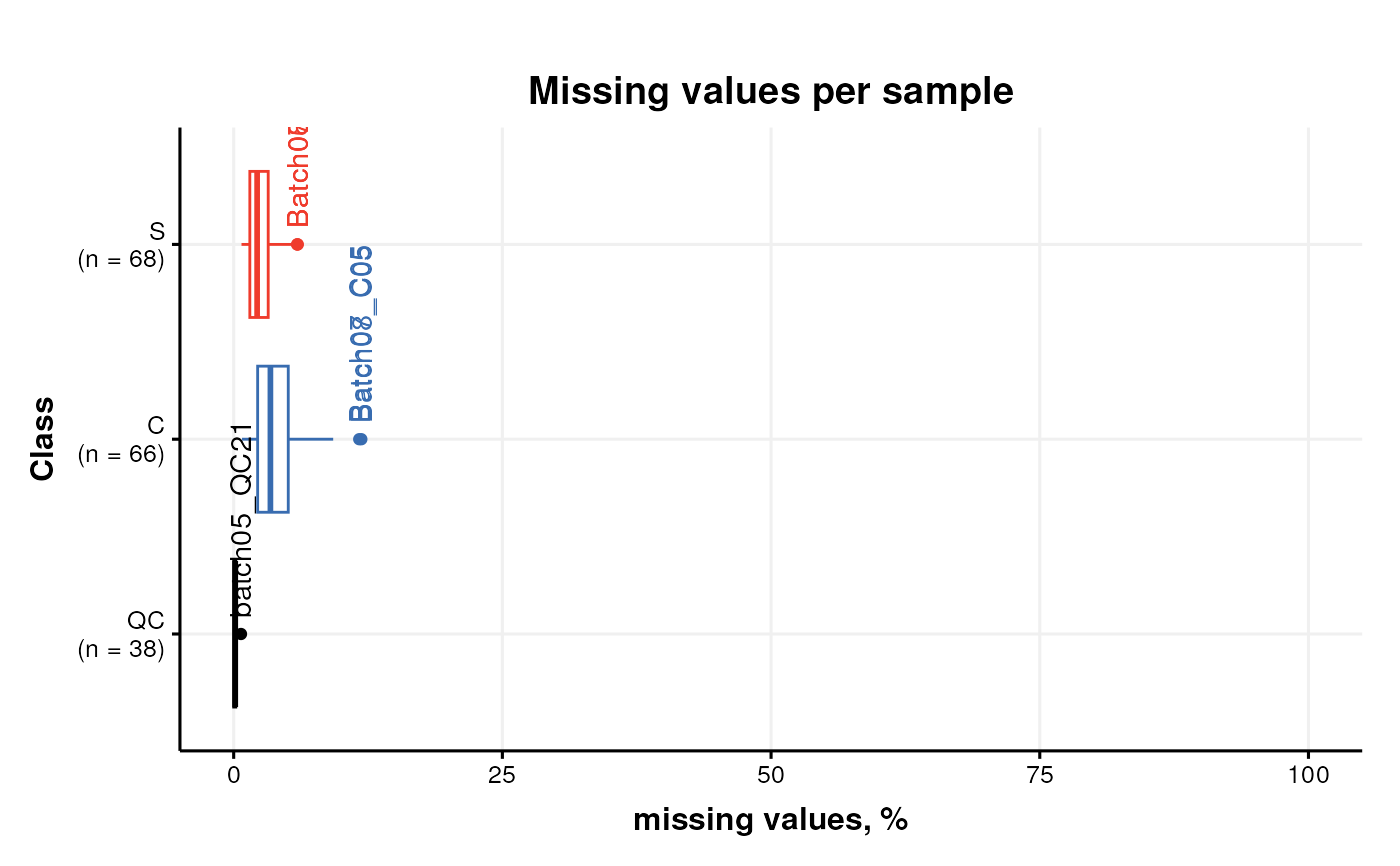
Boxplots of the number of missing values per sample/feature.
Arguments
- label_outliers
(logical) Label outliers. Allowed values are limited to the following:
"TRUE": Sample labels for potential outliers are displayed on the plot."FALSE": Sample labels are not included on the plot.
The default is
TRUE.- by_sample
(logical) Plot by sample or by feature. Allowed values are limited to the following:
"TRUE": Missing values are plotted per sample."FALSE": Missing values are plotted per feature.
The default is
TRUE.- factor_name
(character) The name of a sample-meta column to use.
- show_counts
(logical) Show counts. Allowed values are limited to the following:
"TRUE": The number of samples for each box is displayed."FALSE": The number of samples for each box is not displayed.
The default is
TRUE.- ...
Additional slots and values passed to
struct_class.
Value
A
mv_boxplot
object. This object has no output slots.
See chart_plot in the struct package to plot this chart object.
Inheritance
A mv_boxplot object inherits the following struct classes: [mv_boxplot] >> [chart] >> [struct_class]
Examples
M = mv_boxplot(
      label_outliers = FALSE,
      by_sample = FALSE,
      factor_name = "V1",
      show_counts = FALSE)

D = MTBLS79_DatasetExperiment()
C = mv_boxplot(factor_name='Class')
chart_plot(C,D)